The data represented in this map has been compiled for information purpose only and it does not imply the expression or opinion of IWMI on territorial boundaries of any country. This map may not be used to determine or certify territorial boundaries of any country. IWMI does not assume any legal responsibility for the information in this map.
By accessing and using any of the datasets distributed by IWMI, you acknowledge that you have read, understood, and agree to comply with the terms and conditions contained within this license agreement. IWMI may amend these terms and conditions at any time. Your continued use of this data constitutes acceptance of the terms and conditions stated at the time of your use. You should contact IWMI to determine the current terms and conditions to which you are bound.
All datasets are the property of IWMI and/or other organizations under an agreed MOU concerning general principles of the exchange of data to support the creation of the Water Data Portal unless otherwise noted. You may use these datasets for non-commercial purposes, including research, education, presentations, and non-commercial publications. You understand and agree that you may not copy, reproduce, distribute or create derivative works for other purposes, without prior, written authorization from the IWMI. When using or publishing any parts of these datasets, proper acknowledgement of IWMI and original source(s) in the format requested by the contributor of the data, is required.
IWMI makes reasonable efforts to provide accurate data and information through its website, database, and other channels. Nevertheless, you understand and agree that IWMI shall not be liable for any loss or damage resulting from any use of, or inability to use, this data, or resulting from any errors or omissions in the data content. IWMI and IWMI's sources of information do not guarantee or warrant the accuracy, completeness, currentness, merchantability or fitness for a particular purpose of the database or the media on which the database information is provided. IWMI is providing the database to you "AS IS", without any warranty of any kind, neither express nor implied, statutory or otherwise. You understand and agree that to the maximum extent permitted by law, IWMI, IWMI's source of information and their trustees, officers, employees, independent contractors, or agents shall not be liable to you or to any third party with respect to the data provided, the use of the database or the information contained therein. You understand and agree that IWMI, IWMI's source of information and their trustees, officers, employees, independent contractors, or agents shall not be liable for any loss or damage to any person or property arising out of any use, misuse, unavailability of the data or inability to use the data, or resulting from any errors or omissions in the data content, whether caused in whole or in part by the acts or omission of IWMI or IWMI's sources of information, whether negligent or otherwise and whether arising under intellectual property rights, libel, privacy, publicity, obscenity or any other laws. In no event will IWMI, IWMI's source of information and their trustees, officers, employees, independent contractors, or agents be liable to you or any Third Party, in any form of action, for any damages or losses of any kind whether direct, indirect, special, incidental, consequential of punitive (including but not limited to damages to business reputation, lost business or lost profits or data), whether foreseeable or not and however caused, even if IWMI, IWMI's source of information and their trustees, officers, employees, independent contractors, or agents are advised of the possibility of such damages or losses.
The Solar suitability mapping framework was developed using a GIS-based Multi-Criteria Evaluation (MCE) technique. The multi-criteria evaluation was implemented by combining spatial information from a number of geospatial drivers for solar based irrigation. These data sourced from a number of national and international databases include solar irradiation, slope, groundwater levels, aquifer productivity, groundwater storage, groundwater sustainability, proximity to rivers, proximity to small dams and inland valleys, soil characteristics, crop and land suitability, population, roads and travel time to markets. First, a constraint layer was developed to differentiate areas that would be suitable for solar based irrigation from those that cannot be suitable under any condition. Protected zones, forested and urban areas, and areas with extreme with droughts identified as unsuitable for agricultural production were excluded.
The absolute values of each of the input drivers (solar irradiation, slope, groundwater levels, aquifer productivity, groundwater storage, proximity to rivers, inland valleys and reservoirs, soil texture, soil drainage, soil depth, soil organic carbon, soil available water content, distance to roads, population density and travel time to markets) were rescaled to a 1-5 scale and used to derive weighted combination maps for the suitable areas. Layer weights were determined and assigned using the Saaty Analytic Hierarchy process in a GIS environment. A nearest neighbour resampling scheme was used to resample each of the individual inputs to obtain final suitability areas at a 90 meter resolution.
Suitability for solar-powered irrigation was mapped when considering different water resources: only surface water, only groundwater and both surface and groundwater at various groundwater depths (0-7 m, 7-25 m, 25-50 m, 50 – 100 m, 100-250 m).
Legends were generated using an equal interval class. The legends range from 20% probability in least suitable areas to 100% probability in highly suitable areas. Graduation is as below:
Least suitable 0 - 30% probability
Less suitable 30.1 - 60% probability
Moderately suitable 60.1 - 75% probability
Suitable 75.1 - 90% probability
Highly suitable 90.1% - 100% probability
To improve predictions for your country or region, consider contributing/sharing validation data or additional data so that your data can be included in the framework. IWMI always respects the data policy of data providers and will not publically share any data unless written permission is given to do so. Agencies that contribute their data will be dully acknowledged.
Hengl, T., de Jesus, J.M., Heuvelink, G.B.M., Gonzalez, R.M., Kilibarda, M., Blagotic, A., Wei, S., Wright, M.N., Geng, X., Bauer-Marschallinger, B., Guevara, M.A., Vargas, R., MacMillan, R.A., Batjes, N.H., Leenaars, J.G.B., Ribeiro, E., Wheeler, I., Mantel, S.K., Kempen, B., 2017. SoilGrids250m: Global gridded soil information based on machine learning. PLoS Biol. 12, 729–736.
MacDonald, A.M., Bonsor, H.C., Dochartaigh, B.É.Ó., Taylor, R.G., 2012. Quantitative maps of groundwater resources in Africa. Environ. Res. Lett. 7.
Schmitter, P., Kibret, K.S., Lefore, N., Barron, J., 2018. Suitability mapping framework for solar photovoltaic pumps for smallholder farmers in sub-Saharan Africa. Appl. Geogr. 94, 41–57.
Instructions Select one or both water source(s) you are planning to abstract using solar based pumping.
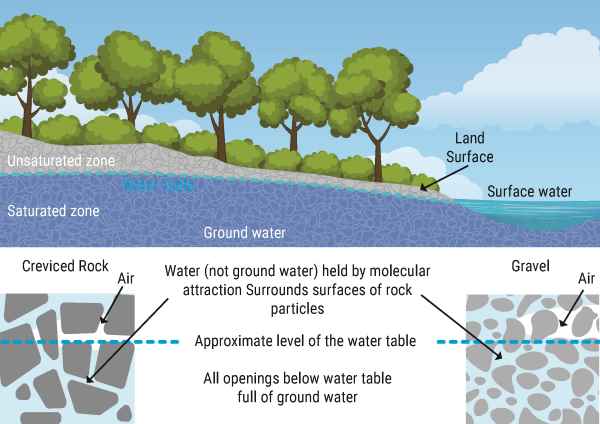
Description Ground water represents all water which occurs below the land surface. It includes both water within the unsaturated and saturated zones.
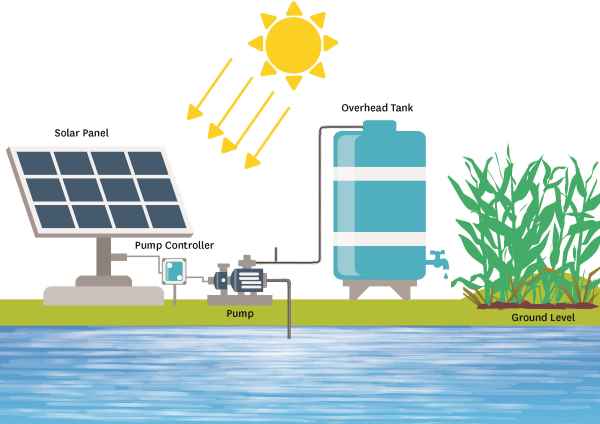
Surface water represents all water above the earth’s surface. This includes lakes, reservoirs, wetlands, rivers, small ponds or any other form of water stored in the landscape.
Instructions Select one or both water source(s) you are planning to abstract using solar based pumping.
Groundwater represents all water which occurs below the land surface. It includes both water within the unsaturated and saturated zones. (for more information see here )
Surfacewater represents all water above the earth's surface. This includes lakes, reservoirs, wetlands, rivers, small ponds or any other form of water stored in the landscape.
Surface water represents all water above the earth’s surface. This includes lakes, reservoirs, wetlands, rivers, small ponds or any other form of water stored in the landscape.
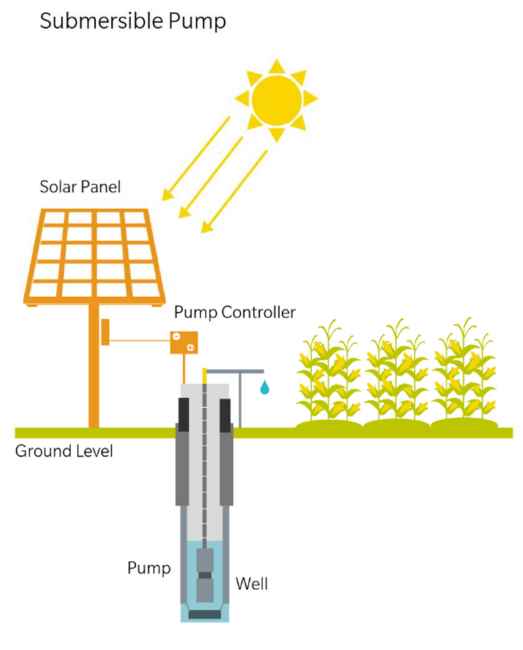
Based on the pump specifications of the surface pump or a submersible pump, select the maximum head (m) where the flow rate first reaches zero (Global LEAP 2019 buyers guide). (photo credit Global LEAP 2019 buyers guide)
0m - 7m: The interval assumes that below 7m the pump would be unable to lift water.
7m - 25m: The interval assumes pump lifts water from 7m to 25m depth only.
25m - 50m: The interval assumes pump lifts water from 25m to 50m depth only.
50m - 100m: The interval assumes pump lifts water from 50m to 100m depth only.
100m - 250m: The interval assumes pump lifts water from 100m to 250m depth only.
0m - 250m: The interval assumes pump lifts water from 0m to 250m depth only.
Pump examples can be accessed here
To estimate the dimensions, type and financial viability of Solar Powered Irrigation Systems for a specific farming situation please use the Solar Powered Irrigation Systems Toolbox here
Legends were generated using an unequal interval class from 0-30% probability in least suitable areas to 90.1-100% probability in highly suitable areas. Graduation is as below:
Least suitable 0 - 30% probability
Less suitable 30.1 - 60% probability
Moderately suitable 60.1 - 75% probability
Suitable 75.1 - 90% probability
Highly suitable 90.1% - 100% probability
The selection summary will display your selected water source, maximum head and country of your interest. You can go back to any of the previous steps if modifications are needed. To analyse the areal suitability click 'Calculate Suitability'.
Instructions: This section will present you calculation results. Multi-section is possible and results upto four calculation sections can be added for analysis.
Once you have select one or more (water source + lifting capacity for underground water + location) you can use below buttons to plot your results, download results or to remove result section.
Welcome to our interactive online tool to assess land suitability for photovoltaic based irrigation using solar energy. The tool supports you in identifying suitable areas for solar based irrigation depending on water sources and pump characteristics. To use the tool, click on the left panel and select your water source, pump capacity and country of interest. For a detailed description on the methodology and spatial information used please go to the methodology tab. As data remains scarce for some countries in Africa we appreciate if you would like to support us by sharing relevant spatial information so we can refine our maps. Please use the lower left box to share any relevant information. As we continuously strive to update and refine the tool for you we would appreciate any feedback. Please use our message button at the top right corner to send us a message or any comments and queries you may have or take a brief survey on the use of the tool.
We hope you enjoy your platform,
The International Water Management Institute, Futurepump and GIZ
GW - Ground Water
SW - Surface Water
GW - Ground Water
SW - Surface Water
Make adjustments to your searches by toggling between them here.
Interested in multiple locations and searches? Add another calculation here before analysing - can add up to 4 at a time.
Select your location by selecting a country. Further localise your selection by district/zone.
You can select Ground water, Surface water or both.
Select a water lifting capacity as necessary for ground water.
Great. You are almost ready to submit your calculations. Click the big arrow to analyse.
Great, you're almost there to submit your calculation, hit the big arrow to analyse.
(All area outputs are calculated in km2)
Calculation | 1 | 2 | 3 | 4 |
---|---|---|---|---|
Location | No Location | Guinea-Bissau | Cameroon | Zimbabwe |
Source | GW/SW | GW/SW | GW/SW | GW/SW |
Depth | X-XXm | X-XXm | X-XXm | X-XXm |
Least Suitable | X | X | X | X |
Less Suitable | X | X | X | X |
Moderately Suitable | X | X | X | X |
Suitable | X | X | X | X |
Highly Suitable | X | X | X | X |
(All area outputs are calculated in km2)
Calculation | 1 | 2 | 3 | 4 |
---|---|---|---|---|
Location | No Location | Guinea-Bissau | Cameroon | Zimbabwe |
Source | GW/SW0 | GW/SW | GW/SW | GW/SW |
Depth | X-XXm0 | X-XXm | X-XXm | X-XXm |
Least Suitable | X0 | X | X | X |
Check about impact of input data for suitability by switching the toggle button at right bottom corner.
Shows the contribution of the main input data layers to solar suitability for a selected area. A thumbs up indicates at least half of the area selected is suitable. A thumbs down indicates more than half of the selected area is not suitable.